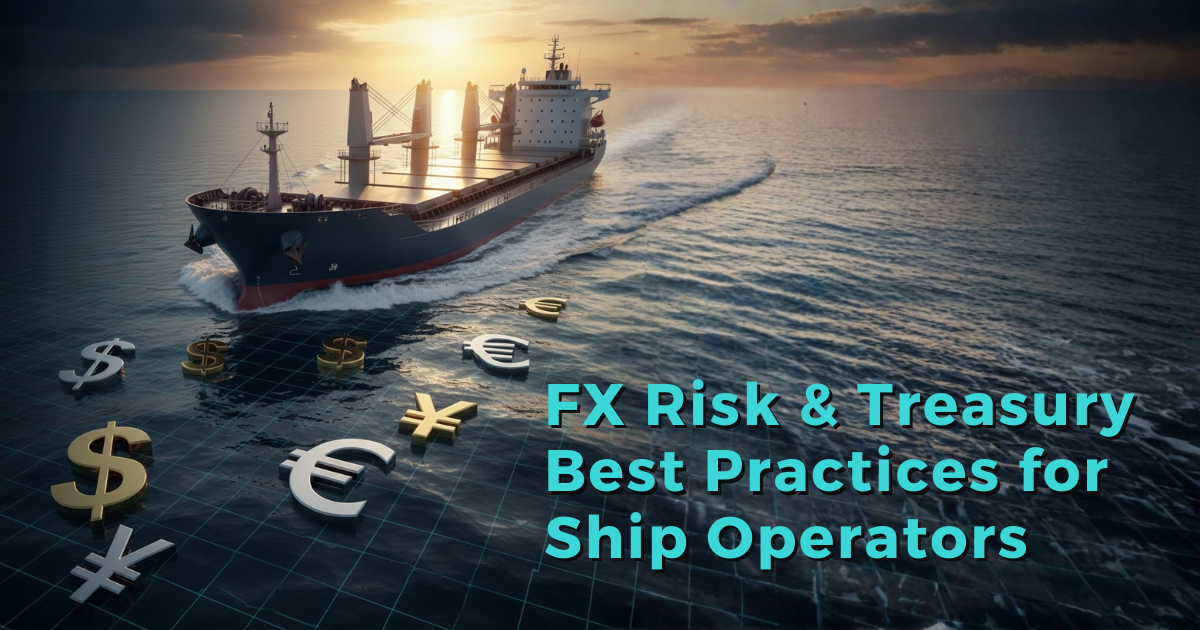
FX Risk & Treasury Best Practices for Ship Operators
1. Understand your exposures (don’t guess) Start by mapping where currency risk actually appears across the voyage lifecycle: Freight receipts:...
Solutions Aligned with Maritime Roles
Model-Specific Business Solutions
Streamlined data insights
Optimized maritime voyage planning
Enhanced financial stability
Maritime-focused business banking
Access legal documents and policies.
Get solutions to all your questions.

Freight markets in 2025 are volatile, fragmented, and increasingly shaped by external shocks. For shipping companies, this volatility is both a threat and an opportunity. Firms that treat analytics not as a reporting tool but as a core strategic capability can transform unpredictability into margin advantage.
Freight indices and day-rates remain choppy: bulk carriers show weaker performance, while tankers remain above long-term averages.
Volatility is driven by geopolitics, demand shocks, supply constraints, and regulatory pressures.
Analytics delivers three benefits: probabilistic forecasting, scenario-based chartering, and voyage-level optimization.
Success depends on structured data, actionable workflows, and a strong feedback loop.
The Baltic Dry Index (BDI) has hovered around ~2,100 in September 2025, well below its 2024 highs but still volatile week-to-week. Tanker earnings, by contrast, remain materially above decade averages, though segment-specific dynamics differ.
For chartering managers, such swings can make or break margins: securing or missing a relet decision by just a few days can translate into hundreds of thousands in P&L.
Geopolitics – Disruptions in the Red Sea and rerouting via the Cape have reshaped voyage economics.
Demand shocks – China’s import cycles and grain seasonality create sudden demand spikes.
Fleet supply constraints – Delivery slippages, slow steaming, and retrofits shrink available tonnage.
Regulatory shifts – CII and EU ETS mechanisms add cost pressures and affect charter premiums.
Financial spillovers – Freight indices increasingly move in sync with broader financial and commodity markets.
In volatile conditions, information is leverage. Analytics enables:
Short-horizon forecasts → to anticipate rate moves in days or weeks.
Scenario planning → to prepare playbooks for route closures, sanctions, or fuel shocks.
Voyage optimization → to balance bunker costs, speed, and port choices against rate scenarios.
Done right, analytics is not just a dashboard but a decision engine.
Forecasting tools: probability bands for spot and time-charter rates.
Scenario engines: simulate disruptions and create predefined commercial responses.
Optimization models: recommend voyage speeds, routes, and contract choices.
Counterparty overlays: combine sanctions and payment-risk data into pricing.
Performance monitoring: measure forecast error and commercial outcomes to improve over time.
Define KPIs – e.g., realized P&L vs forecast, forecast error reduction.
Build a clean data foundation – market indices, AIS/voyage logs, bunker costs, macro indicators.
Deploy models – use ensemble methods and scenario simulations.
Integrate with chartering workflows – analytics must recommend actions, not just display charts.
Iterate & govern – keep humans in the loop and track model calibration.
Start with one decision (relet timing or COA pricing).
Acquire high-quality market and voyage data.
Benchmark forecasts against simple baselines.
Develop three geopolitical scenario playbooks.
Roll out with a “recommendation + override” flow.
Measure outcomes and refine quarterly.
Volatility is opportunity: the greater the swings, the greater the payoff from timely data.
Invest in foundational data before advanced models.
Combine forecasts with scenarios and playbooks.
Embed analytics into workflows, not just dashboards.
Measure rigorously and keep expertise central.

1. Understand your exposures (don’t guess) Start by mapping where currency risk actually appears across the voyage lifecycle: Freight receipts:...

Summary In recent maritime logistics literature, payment delays across freight, shipping, and related supply chain services have been found to...

The maritime sector is entering a new software era. As regulatory pressure grows, data volumes explode, and commercial margins stay thin, shipowners...