Introduction: Decarbonization Meets the Balance Sheet
For decades, the shipping industry measured profitability with one benchmark: freight earned minus voyage costs. But in 2025, profitability is no longer just about fuel prices, port delays, or charter rates.
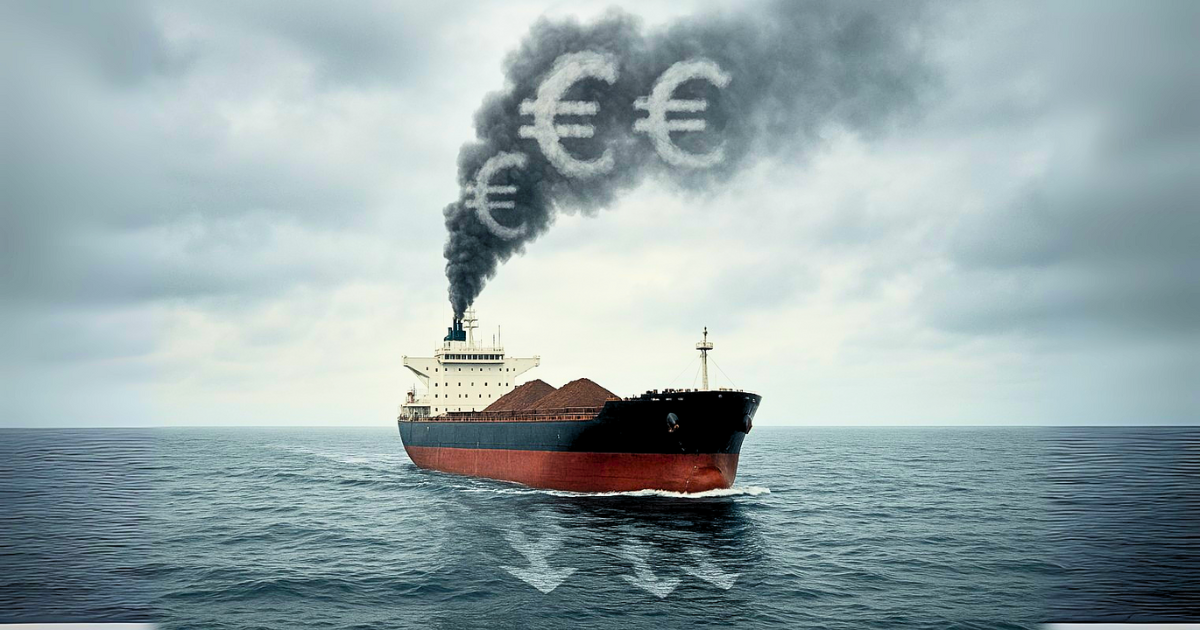
Two regulatory forces—IMO’s Carbon Intensity Indicator (CII) and the EU Emissions Trading System (EU ETS)—are fundamentally reshaping how owners, charterers, and operators calculate voyage economics.
These aren’t theoretical policies—they’re financial realities. A vessel with poor CII performance can lose marketability overnight. A European voyage without carbon allowances factored into costs can turn profitable cargo into a loss-making trade.
In this article, we’ll unpack how CII and EU ETS compliance costs directly impact P&L, influence chartering strategies, and change fuel choices across the industry.
1. Decarbonization Moves From Policy to Profitability
The Bigger Picture
Shipping contributes nearly 3% of global CO₂ emissions. Regulators, financiers, and cargo owners are pushing for greener operations—not as optional CSR, but as enforceable rules with direct financial consequences.
-
IMO’s CII (since 2023): Measures how efficiently a vessel transports cargo per unit of CO₂ emitted. Rated from A (best) to E (worst).
-
EU ETS (since 2024): Requires ships trading in Europe to buy carbon allowances for CO₂ emissions—phased in at 40% (2024), 70% (2025), and 100% (2026).
The message is clear: profitability is no longer measured in freight rates alone—it’s tied to carbon efficiency.
2. Understanding the Carbon Intensity Indicator (CII)
How CII Works
CII is calculated as:
CII = (CO₂ Emissions / Transport Work)
Where:
Each vessel type/size has a required CII score that tightens annually.
The Financial Implications
A Panamax bulker rated “E” in 2025 may see 15–20% lower earnings compared to a “B” vessel, simply due to charterer preference.
Strategic Trade-Offs
-
Slow steaming improves CII but increases voyage duration, reducing annual revenue.
-
Retrofits (e.g., energy-saving devices) improve ratings but require capex.
-
Fuel switching to LNG, methanol, or biofuels helps, but adds OPEX complexity.
CII compliance is, in effect, a profitability management tool—not just a technical metric.
3. The EU ETS: Carbon Becomes a Commodity Cost
How EU ETS Applies to Shipping
The EU ETS covers:
Shipping companies must purchase EU Allowances (EUAs), with prices averaging €80–100 per ton of CO₂ in 2024.
The Impact on Voyage Costs
Example:
-
A standard Capesize voyage Brazil → Rotterdam emits ~25,000 tons of CO₂.
-
At €90 per ton, that amounts to €2.25 million in carbon costs.
-
By 2026 (with a 100% phase-in), this becomes unavoidable.
For many trades, carbon costs will exceed port dues and rival bunker expenses.
Commercial Pressure
-
Charterers may shift to eco-tonnage to reduce EUA liabilities.
-
Owners with non-compliant ships will face lower time-charter rates or longer idle periods.
-
Banks and investors increasingly link loan covenants to EU ETS compliance.
Carbon pricing is no longer environmental—it’s voyage P&L math.
4. How CII & EU ETS Reshape Voyage Profitability
P&L Calculations Must Evolve
Traditional voyage P&L includes:
-
Freight/Hire
-
Bunkers
-
Port Charges
-
Canal Dues
-
Agency Fees
Now, add two new cost lines:
A voyage once projected at $1.5M profit could drop to $800k after carbon and compliance deductions.
Chartering Dynamics Shift
-
Charterers Prefer Efficient Ships: Cargo owners want to minimize exposure to EU ETS and avoid poor CII ratings.
-
Contract Clauses Are Changing: “Carbon cost pass-through” clauses are becoming standard in time charters.
-
Shorter Fixture Durations: Charterers may avoid committing long-term to vessels with uncertain CII trajectories.
Fuel Choices Drive Competitiveness
-
VLSFO vs LNG: LNG may reduce emissions by ~20%, cutting EU ETS exposure.
-
Biofuels: Improve CII scores but cost 1.5–2× conventional fuels.
-
Future Fuels (methanol, ammonia): Require major retrofits but can deliver compliance advantages.
In practice, fuel decisions are no longer purely about price—they’re strategic levers for P&L.
5. Case Study: A Tale of Two Voyages
Let’s compare two voyages on similar routes:
Voyage A: Older Panamax, Rated D, Using VLSFO
-
Freight Income: $2.5M
-
Voyage Costs (fuel, port, canal): $1.7M
-
Carbon Costs (EU ETS): €1.2M ($1.3M)
-
Profit: $-500k (loss)
Voyage B: Modern Panamax, Rated B, Using LNG
-
Freight Income: $2.5M
-
Voyage Costs: $1.9M (LNG premium)
-
Carbon Costs: €800k ($850k)
-
Profit: $-250k (small loss, but competitive)
Result: Charterer prefers Voyage B—not because it’s cheaper on day one, but because long-term exposure to carbon costs and CII downgrades makes Voyage A a liability.
6. The Broader Industry Implications
Asset Valuations Will Diverge
-
Green premium: Efficient ships gain higher resale values.
-
Brown discount: Older, inefficient vessels may become stranded assets earlier.
Financing and Loan Covenants Tighten
Banks (under Poseidon Principles) now assess lending based on CII alignment and carbon exposure. Non-compliant fleets face higher interest rates or restricted access to capital.
Chartering Market Fragmentation
Cargo Owner Pressures
Big shippers like IKEA, Amazon, and Shell demand greener supply chains. Owners unable to prove compliance risk losing cargo contracts altogether.
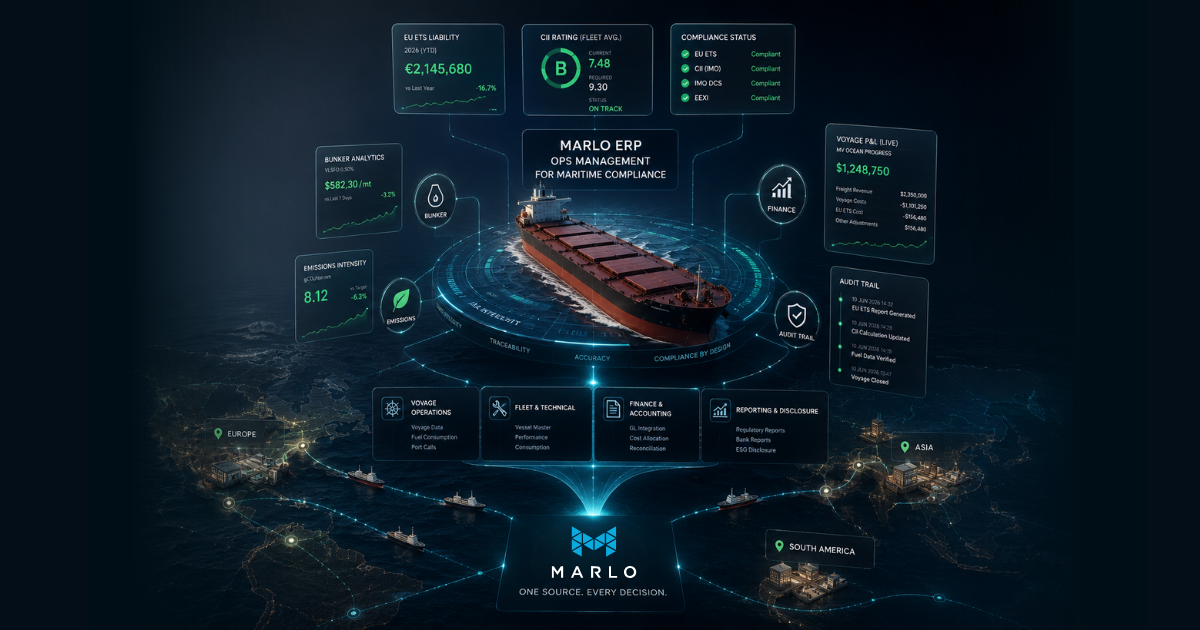
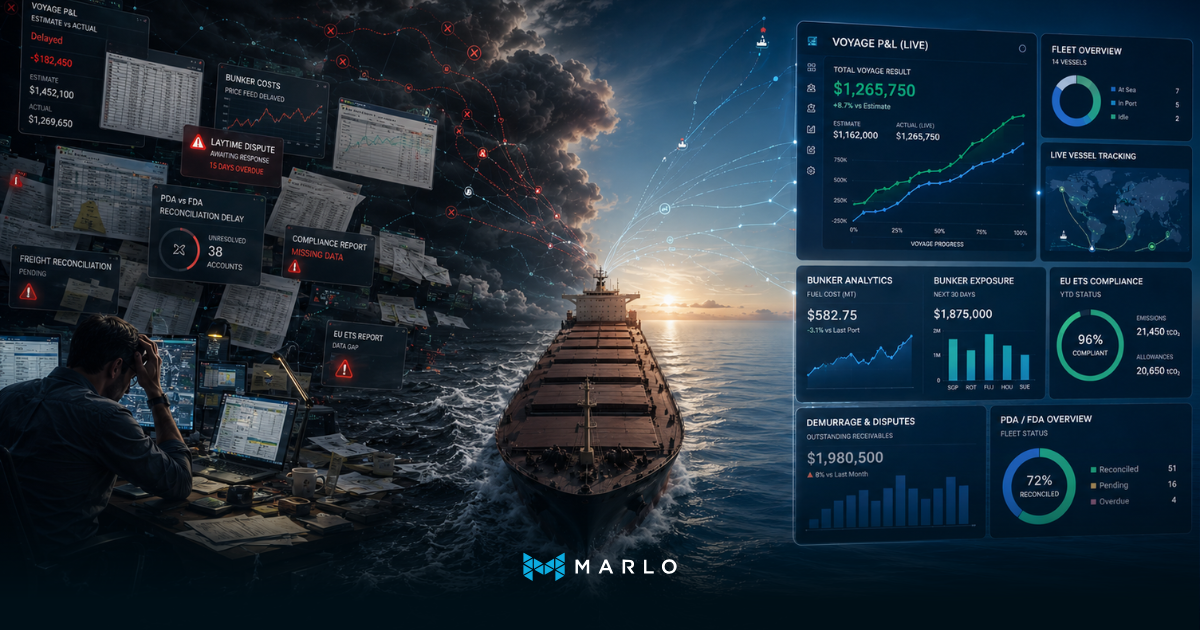
7. The SaaS Advantage: Navigating Decarbonization with Data
Compliance isn’t just a regulatory exercise—it’s a data and analytics challenge.
What’s Needed:
-
CII Monitoring Dashboards
-
Carbon Cost Calculators (EU ETS)
-
Scenario Modeling
-
Integrated P&L Impact
-
Combine freight, bunker, port, and carbon costs in one dashboard.
-
Link to receivables/payables for financial transparency.
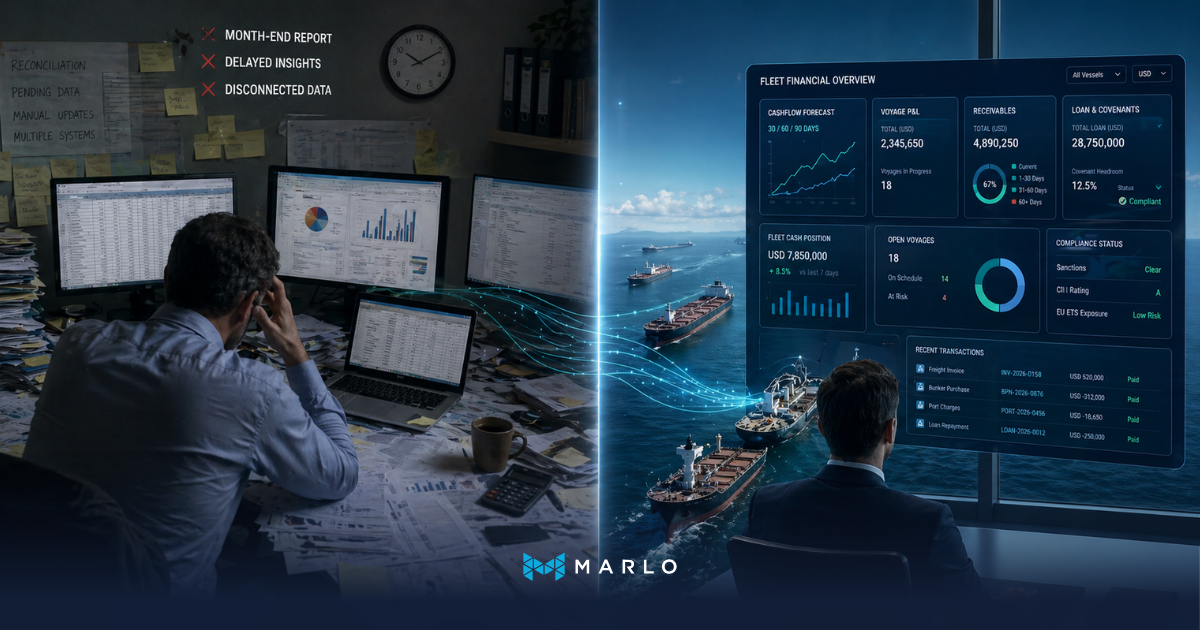
The Competitive Edge
Companies that can simulate, forecast, and act on decarbonization costs in real time will not only remain compliant—they’ll secure more cargoes, attract better financing, and protect margins.
8. Strategic Roadmap for CXOs
-
Audit Your Fleet: Understand current CII ratings and EU ETS exposure.
-
Engage Charterers Early: Negotiate carbon clauses and cost-sharing.
-
Invest in Fuel Flexibility: Explore LNG, biofuels, and retrofits.
-
Adopt SaaS Platforms: Move beyond spreadsheets—integrate compliance into voyage economics.
-
Shift Mindset: Treat decarbonization costs as core voyage expenses, not add-ons.
Conclusion: Profitability in the Carbon Age
CII and EU ETS aren’t passing trends—they’re structural shifts in how shipping makes money.
The new profitability formula isn’t just freight minus bunkers. It’s:
Freight – (Bunkers + Ports + Carbon + Compliance).
For owners and operators, the choice is clear: adapt P&L models now, or risk obsolescence.
The winners in the decarbonization era will be those who combine efficient ships, smart fuel choices, and data-driven SaaS platforms that put compliance at the center of financial decision-making.
Because in 2025 and beyond, green isn’t just good for the planet—it’s good for the bottom line.
-1.png) Alex
Alex