Introduction: Riding the Freight Market Rollercoaster
The freight market has always been cyclical, but recent years have shown just how turbulent it can be. From pandemic disruptions and geopolitical conflicts to fluctuating fuel prices and shifting trade flows, volatility has become the new normal. For chartering managers and shipowners, this volatility is both a risk and an opportunity. The real differentiator lies in how well you can transform market data into actionable insights.
This blog explores how shipping analytics, freight market trends, and freight visibility can empower maritime stakeholders to not only survive—but thrive—in volatile conditions.
1. The Reality of Freight Market Volatility
Shipping cycles have always been unpredictable. However, today’s volatility is sharper and more complex due to:
-
Global trade disruptions: Geopolitical conflicts (Ukraine, Red Sea tensions), trade sanctions, and regional shifts in supply chains.
-
Environmental regulations: The IMO’s Carbon Intensity Indicator (CII) and the EU Emissions Trading System (EU ETS) are altering operational costs.
-
Fuel market swings: Bunker prices fluctuate based on crude oil markets, demand shifts, and alternative fuel adoption.
-
Supply-demand mismatch: Vessel availability and cargo flows are no longer regionally predictable.
For a chartering manager, these variables make voyage profitability calculations far more uncertain. What looks like a good fixture today might be unprofitable tomorrow.
2. Why Traditional Methods Fall Short
Many shipping companies still rely on:
-
Manual spreadsheets
-
Personal experience and gut feeling
-
Fragmented data from brokers, emails, and PDFs
While intuition has its place, it’s increasingly inadequate. Volatility moves faster than a spreadsheet can be updated, and fragmented information clouds decision-making. Without a consolidated view of freight visibility and market trends, opportunities are easily missed.
3. The Case for Shipping Analytics
Analytics-driven decision-making is no longer optional; it’s a competitive necessity. Shipping analytics platforms integrate data from multiple sources—market reports, voyage performance, bunker indices, sanctions lists—and present it in real time.
Key benefits include:
-
Freight trend forecasting: Spotting short-term demand shifts before they hit the market.
-
Voyage optimization: Comparing fixtures across vessels, fuel costs, and compliance exposure.
-
Counterparty intelligence: Tracking charterer and broker performance histories.
-
Profitability modeling: Running “what-if” scenarios (e.g., how carbon costs or bunker surcharges affect margins).
Companies with analytics capability can react faster, negotiate smarter, and minimize exposure to bad fixtures.
4. Turning Data into a Chartering Advantage
Here’s how leading operators are applying freight data to strengthen chartering strategies:
a. Dynamic Market Positioning
Instead of relying on static reports, analytics platforms allow managers to see real-time vessel positions, open cargoes, and market sentiment. This agility helps identify profitable trade lanes ahead of competitors.
b. Smart Fixture Negotiation
Armed with accurate benchmarks—such as recent Time Charter Equivalent (TCE) rates or bunker adjustment factors—chartering teams can negotiate with greater confidence.
c. Fuel & Compliance Sensitivity Analysis
Analytics tools simulate how different fuel prices or compliance penalties (like CII downgrade risks) impact fixture profitability, helping managers make informed choices.
d. Scenario Planning
What happens if bunker prices spike 20% next month? Or if EU ETS costs double? With analytics, such “what-if” simulations turn uncertainty into strategic foresight.
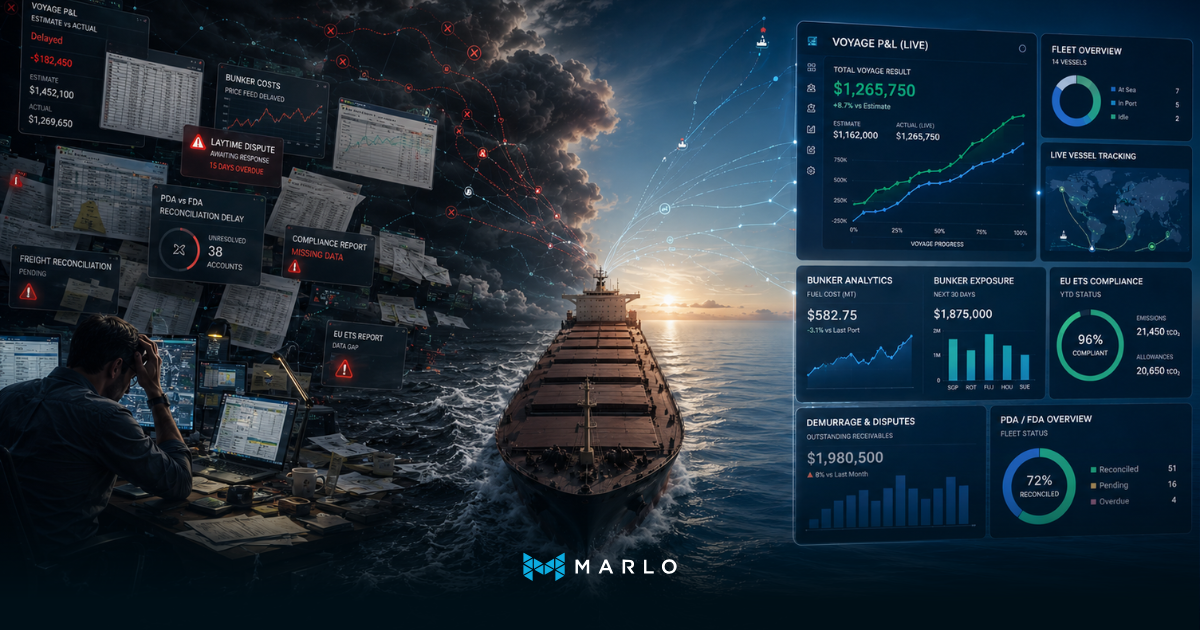
5. Freight Visibility as Risk Mitigation
Freight visibility—knowing where vessels, cargoes, and market opportunities lie at any given time—is critical for risk management. In volatile markets, visibility enables:
-
Avoiding costly ballasting by spotting cargoes near your open tonnage.
-
Monitoring sanctions compliance by tracking voyage patterns and counterparties.
-
Reducing idle time by aligning chartering decisions with operational realities.
The result: less waste, more profitability.
6. Real-World Example: Dry Bulk Volatility
Take the dry bulk market. Cape, Panamax, and Supramax segments often diverge sharply based on regional cargo flows (iron ore, coal, grains). With analytics, operators can:
-
Forecast seasonal grain demand spikes in South America.
-
Compare spot vs. period chartering opportunities.
-
Optimize ballasting decisions based on real-time cargo lists.
A company that relies solely on brokers’ daily reports may miss these shifts. A company that integrates analytics reacts before the competition does.
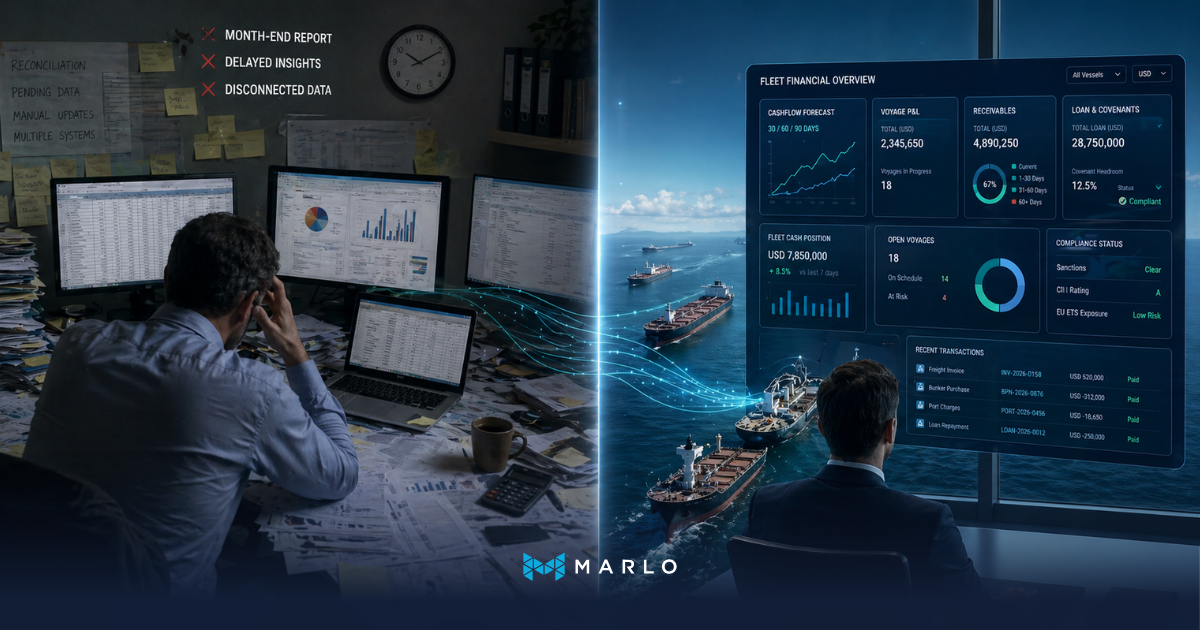
7. Building an Analytics-Driven Culture
Technology is just one part of the puzzle. To truly harness shipping analytics:
-
Upskill teams: Chartering and operations staff must learn to interpret data, not just collect it.
-
Integrate systems: Data silos (chartering, operations, finance) need to connect for a holistic view.
-
Trust the numbers: Build decision workflows where data insights inform—but do not completely replace—human judgment.
The future chartering manager is as much a data strategist as a dealmaker.
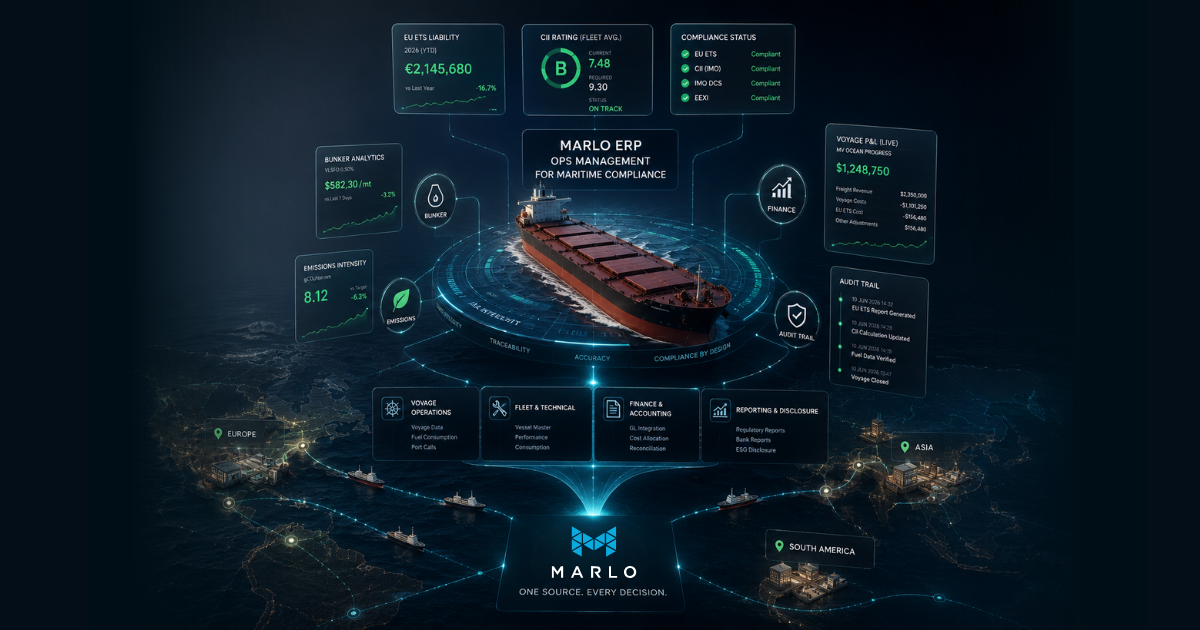
8. The Marlo Perspective
At Marlo, we believe freight market volatility is not a threat—it’s an opportunity. Our Analytics module is designed to:
-
Deliver real-time market rates (spot and forward).
-
Provide cashflow and valuation insights tied to fixtures.
-
Enhance credit risk checks on counterparties.
-
Model voyage profitability under multiple fuel and compliance scenarios.
By combining freight visibility with financial and operational data, Marlo helps shipping companies turn volatility into competitive advantage.
Conclusion: Volatility as Opportunity
The freight market will never be stable—that’s the nature of global shipping. But in today’s environment, volatility doesn’t have to mean vulnerability. With the right shipping analytics and freight visibility tools, chartering teams can anticipate risks, seize opportunities, and strengthen profitability.
For those who embrace digitalization, volatility becomes less of a storm—and more of a tailwind.
-1.png) Alex
Alex