Marlo ERP Ops Management for Maritime Compliance
Maritime compliance obligations have expanded significantly over the past three years. EU ETS reporting, CII ratings, IMO Carbon Intensity...
Solutions Aligned with Maritime Roles
Model-Specific Business Solutions
Streamlined data insights
Optimized maritime voyage planning
Enhanced financial stability
Maritime-focused business banking
Access legal documents and policies.
Get solutions to all your questions.
13 min read
-1.png) Alex
:
Jan 16, 2026
Alex
:
Jan 16, 2026
For CFOs and operations managers at dry bulk shipping companies, accurate voyage P&L calculation isn't just an accounting exercise; it's the foundation of profitable decision-making. Every fixture negotiation, route selection, and operational choice ultimately depends on understanding whether a voyage will generate profit or loss. Yet many operators struggle with voyage P&L accuracy, leading to poor commercial decisions, cash flow surprises, and missed opportunities.
This comprehensive guide walks you through the precise methodology for calculating voyage profit and loss, common pitfalls to avoid, and how modern software solutions are transforming this critical process.
Before diving into calculations, let's establish why getting voyage P&L right is mission-critical for dry bulk operators.
Every commercial decision in shipping relies on voyage economics. When chartering managers evaluate a cargo offer, they need to know: Will this voyage generate acceptable returns? How does it compare to alternative employment? Should we position ballast to capture a better fixture, or take the cargo that's available now?
Inaccurate voyage estimates lead to accepting unprofitable business, rejecting good opportunities, or making suboptimal routing decisions. A miscalculation that underestimates costs by just 10% can transform an apparently profitable voyage into a loss-maker.
For mid-sized operators with 5-50 vessels, working capital management is perpetually tight. Voyage P&L directly drives cash flow forecasting. If your estimates show a $50,000 profit but the actual result is a $20,000 loss, that $70,000 variance multiplied across multiple concurrent voyages can create serious liquidity problems.
Understanding voyage economics also helps negotiate better payment terms with charterers and plan for upcoming capital requirements like bunker purchases or port disbursements.
Accurate voyage P&L enables meaningful performance analysis. Which routes consistently deliver better returns? Which vessels outperform fleet averages? Are certain charterers more profitable to work with? Without reliable voyage-level financial data, these critical questions remain unanswered.
Voyage revenue forms the income side of your P&L equation. For voyage charters in the dry bulk sector, this calculation appears straightforward but contains important nuances.
The fundamental revenue calculation starts with:
Gross Freight = Freight Rate × Cargo Quantity
For example, if you're carrying 50,000 metric tonnes of coal at $18 per tonne, your gross freight is $900,000.
However, freight rate structures vary. Rates may be quoted as dollars per metric tonne, lump sum for the entire voyage, or based on other units depending on the commodity and charter party terms. Always verify which unit applies to your specific fixture.
Beyond basic freight, several other revenue streams can contribute to voyage income:
Demurrage Revenue: If the charterer exceeds the allowed laytime for loading or discharge operations, you earn demurrage at the agreed daily rate. This compensates you for the vessel being detained beyond the contracted time.
For example, if laytime is exceeded by 2.5 days and the demurrage rate is $25,000 per day, you would add $62,500 in demurrage revenue. Demurrage is calculated on a pro-rata basis, meaning partial days count proportionally.
Despatch Payments: Conversely, if the charterer completes cargo operations faster than the allowed laytime, they may earn despatch money. The despatch rate is typically half the demurrage rate—a common clause is "despatch half demurrage" (DHD or D½D).
If operations finish 1.5 days early with a despatch rate of $12,500 per day (half of a $25,000 demurrage rate), you would deduct $18,750 from your revenue as despatch owed to the charterer.
Deadfreight: If the charterer fails to load the agreed cargo quantity, they owe deadfreight on the shortage. This compensates you for the lost cargo space at the contracted freight rate.
Your net freight—the actual revenue you'll receive—requires deducting commissions from gross freight:
Net Freight = Gross Freight - Brokerage Commission - Address Commission
Commissions reduce your revenue and must be accurately calculated. Two types of commissions typically apply in dry bulk voyage charters.
Shipbrokers earn commission for arranging the charter party. The standard brokerage rate is 1.25% per broker. If multiple brokers are involved in a transaction, each typically receives 1.25% on the gross freight.
For our $900,000 gross freight example with two brokers involved:
Brokerage is calculated on gross freight including any primage (an additional percentage on freight, though this is less common in modern charters).
Address commission compensates the charterer for their shipping department costs and typically ranges from 1.25% to 3.75% of gross freight, with 2.5% being common.
Using our example with 2.5% address commission:
So total commissions of $45,000 ($22,500 + $22,500) would be deducted from the $900,000 gross freight, leaving net freight of $855,000.
Important Note: Commissions are calculated on freight earned, not necessarily freight agreed. If deadfreight or demurrage applies, these may also be subject to commission depending on charter party terms.
Bunker costs represent one of the largest and most variable voyage expenses, typically accounting for 25-50% of total voyage costs. Accuracy here is critical.
Modern vessels primarily use:
Calculate bunker requirements based on:
Example Calculation:
Consider a Panamax vessel with these consumption rates:
Sea passage fuel:
Port fuel:
Total consumption: 680 tonnes VLSFO + 52.8 tonnes MGO
Multiply consumption by current bunker prices. Prices vary significantly by port and change daily, so use prices relevant to your planned bunkering locations.
At assumed prices of $550/tonne VLSFO and $650/tonne MGO:
Don't forget to account for:
Port expenses vary widely by location, cargo type, and vessel size. These costs must be estimated for both loading and discharge ports.
Port costs typically include:
Pilotage: Fees for pilots who guide the vessel in and out of port, based on vessel size and draft
Towage: Tug boat assistance for berthing and unberthing operations
Port Dues: Charges for using port facilities, calculated on gross tonnage or cargo quantity
Agency Fees: Local port agent fees for coordinating the port call and handling documentation
Cargo-Related Charges: May include wharfage, berth hire, or terminal handling charges depending on charter party terms
Fresh Water: If bunkering fresh water for the vessel
Miscellaneous: Garbage disposal, customs clearance, security charges, health inspections
For accurate port cost estimates:
For a typical Panamax dry bulk vessel:
Loading Port (e.g., Richards Bay, South Africa):
Discharge Port (e.g., Rotterdam, Netherlands):
Combined port costs: $67,500
If your voyage route includes major canals or waterways, these fees can be substantial and must be factored into voyage economics.
Suez Canal tolls are calculated based on the Suez Canal Net Tonnage (SCNT) and whether the vessel transits laden or in ballast. For dry bulk vessels, laden transit costs significantly more than ballast.
A typical Panamax bulk carrier (around 75,000 DWT) might pay $250,000-$350,000 for a laden transit through Suez, depending on specific SCNT calculation and current tariff rates.
Panama Canal tolls for the Neopanamax locks are based on vessel type, size (PC/UMS tons), and whether laden or ballast. A laden dry bulk vessel transit might cost $150,000-$300,000 depending on vessel specifications.
Don't overlook smaller but still significant waterway fees:
For our example voyage, if the route requires Suez Canal transit:
Suez Canal (laden northbound): $280,000
This single line item can dramatically impact voyage profitability, which is why route selection (via Suez vs. Cape of Good Hope, or via Panama vs. around Cape Horn) is a critical commercial decision that depends on accurate voyage P&L calculation.
Laytime calculations significantly impact final voyage P&L and are a frequent source of disputes and errors.
Laytime is the period agreed between owner and charterer for loading and discharging cargo operations. Common terms include:
SHEX: Sundays and Holidays Excluded - cargo operations pause on these days SHINC: Sundays and Holidays Included - cargo operations continue through weekends and holidays Weather Working Days (WWD): Only days with suitable weather count Running Days: All days count continuously regardless of weather or holidays
If actual cargo operations exceed allowed laytime, the vessel is "on demurrage" and the charterer owes the owner compensation.
Example:
The phrase "once on demurrage, always on demurrage" means that typical laytime exceptions (like weekends or holidays) generally don't apply during demurrage unless explicitly stated in the charter party.
If operations complete faster than allowed laytime, the owner owes despatch to the charterer:
Example:
Accurate laytime calculation requires:
Many disputes arise from differing interpretations of laytime terms, making this one of the most legally complex aspects of voyage accounting.
Several additional costs round out the complete voyage P&L calculation.
Depending on charter party terms, you may incur:
For our example voyage:
Now we can assemble all components into the complete voyage P&L:
Net voyage profit/(loss): ($96,820)
This voyage would result in a loss of nearly $97,000—a critical finding that should lead to rejecting the cargo, negotiating better freight terms, or finding route alternatives.
Beyond absolute profit/loss, calculate performance metrics:
Time Charter Equivalent (TCE) = (Net revenue - Voyage expenses) / Voyage days
Using our example:
A TCE of $3,066/day for a Panamax vessel in 2026 would be unacceptably low, further confirming this voyage should be declined unless terms improve substantially.
Even experienced operators make voyage P&L mistakes. Here are the most frequent errors and mitigation strategies.
The Problem: Using outdated consumption figures or failing to account for weather, currents, or speed variations.
Impact: Bunker costs can vary by 20-30% from estimates, eliminating expected profit margins entirely.
Solution:
The Problem: Missing or underestimating port disbursement charges, especially miscellaneous fees.
Impact: Port costs can exceed estimates by $10,000-$30,000 per port call.
Solution:
The Problem: Incorrect interpretation of laytime terms, missing exceptions, or arithmetic errors.
Impact: Demurrage disputes averaging $50,000-$150,000 are common in dry bulk shipping.
Solution:
The Problem: Applying incorrect commission percentages or calculating on wrong base amounts.
Impact: Overpaying or underpaying commissions by thousands of dollars, creating disputes or financial losses.
Solution:
The Problem: Failing to account for currency conversion when freight is in one currency and costs in another.
Impact: Exchange rate movements can swing voyage results by 3-5% or more.
Solution:
The Problem: Not considering alternative routes or failing to account for all costs on chosen route.
Impact: Missing opportunities for $50,000-$200,000 in savings through different routing.
Solution:
The Problem: Assuming exact cargo quantity when actual intake depends on draft, trim, and loading conditions.
Impact: Revenue variations of $10,000-$50,000 from deadweight cargo calculations.
Solution:
The Problem: Incorrectly allocating fixed daily running costs or miscalculating voyage duration.
Impact: TCE calculations off by $1,000-$3,000 per day affecting employment decisions.
Solution:
Manual voyage P&L calculation using spreadsheets is time-consuming, error-prone, and difficult to maintain across multiple concurrent voyages. Modern voyage management software transforms this process.
Purpose-built voyage management systems pull data automatically from multiple sources:
This eliminates manual data entry and ensures estimates use current information.
Rather than waiting weeks after voyage completion to understand profitability, modern systems provide:
CFOs gain unprecedented visibility into voyage economics, enabling proactive intervention when voyages deviate from plan.
Software enables rapid "what-if" analysis:
This supports better commercial decision-making under tight time pressure.
Voyage management systems maintain:
Advanced systems include specialized laytime calculators that:
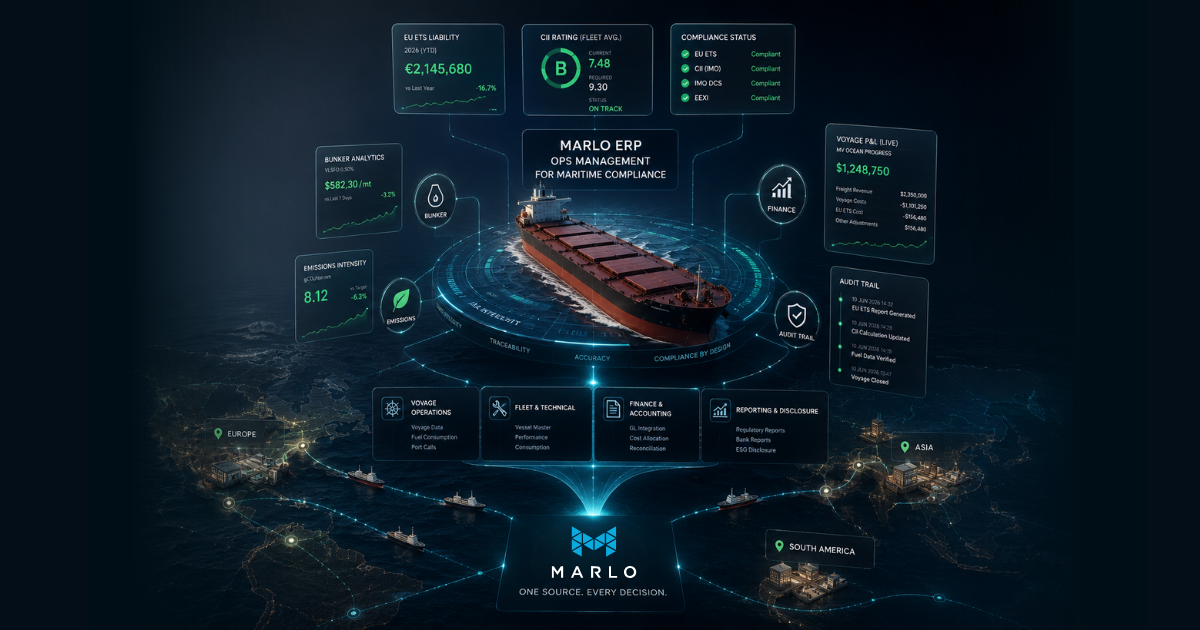
For dry bulk operators managing 5-50 vessels, Marlo provides an integrated platform that transforms voyage P&L from a manual, time-consuming process into an automated, real-time decision-support tool.
Marlo's voyage calculator pulls together all cost and revenue elements in a single interface:
Chartering managers can evaluate cargo opportunities in minutes rather than hours, comparing multiple scenarios before committing to fixtures.
Once a voyage is fixed, Marlo continuously updates the P&L as:
CFOs see current voyage results across the entire fleet on a single dashboard, with variance analysis highlighting which voyages are outperforming or underperforming estimates.
Marlo helps control voyage expenses through:
Voyage P&L data flows seamlessly into your accounting system:
As regulations like EU ETS and FuelEU Maritime introduce carbon costs into voyage economics, Marlo's compliance module automatically:
This ensures voyage P&L reflects the true total cost including environmental compliance, critical for accurate decision-making in 2026's regulatory environment.
Accurate voyage P&L calculation is fundamental to profitable dry bulk operations. By following the step-by-step methodology in this guide, avoiding common errors, and leveraging modern software automation, you can transform voyage economics from a backward-looking accounting exercise into a forward-looking decision support capability.
Voyage P&L accuracy drives commercial success: Every fixture decision, route choice, and operational trade-off depends on reliable voyage economics
Detail matters: Small errors in bunker estimates, port costs, or commission calculations compound across multiple voyages to create significant financial impact
Laytime is complex: Demurrage and despatch calculations require careful attention to charter party terms and detailed documentation
Manual processes don't scale: Spreadsheet-based voyage estimation becomes unmanageable beyond a handful of vessels and creates substantial error risk
Real-time visibility changes the game: Moving from post-voyage analysis to continuous P&L monitoring enables proactive management and better outcomes
Integration amplifies value: Connecting voyage P&L to accounting, compliance, and operations systems creates a single source of truth
Ready to eliminate manual voyage calculations and gain real-time visibility into your fleet's profitability?
Marlo's integrated voyage management platform provides:
✓ Automated voyage P&L calculation with live market data
✓ Real-time tracking of actual vs. estimated performance
✓ Scenario comparison for multiple cargo opportunities
✓ Laytime and demurrage/despatch management
✓ Compliance cost integration (EU ETS, FuelEU)
✓ Financial system integration for seamless accounting
Start Your Free 30-Day Trial →
Join dry bulk operators who have reduced voyage estimation time by 75% while improving accuracy and decision-making with Marlo's purpose-built voyage management solution.
About Marlo: Marlo provides integrated software solutions for dry bulk shipping companies, combining voyage management, compliance tracking, and financial operations in a single platform designed specifically for the maritime industry. Learn more at www.marlo.co
Maritime compliance obligations have expanded significantly over the past three years. EU ETS reporting, CII ratings, IMO Carbon Intensity...
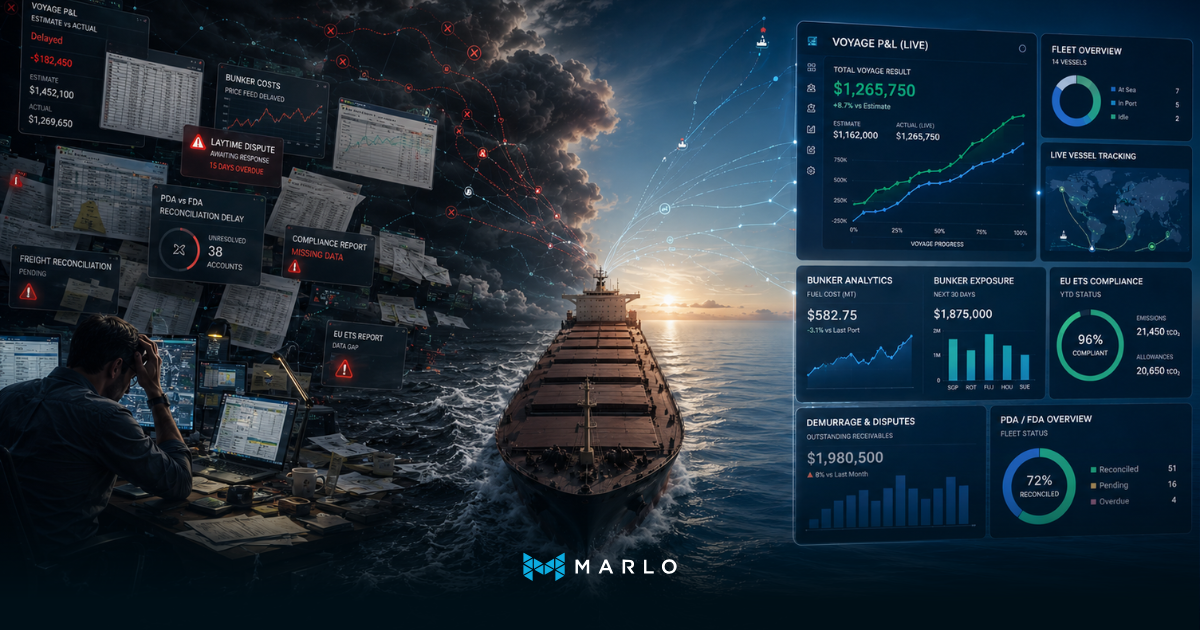
Shipping companies invest in operations software to gain control over voyage P&L, bunker costs, laytime exposure, and compliance obligations. Yet...

For most mid-size shipping companies, the CFO's financial picture of the fleet is assembled once a month. Voyage P&L comes from the operations...