-1.png) Alex
Alex
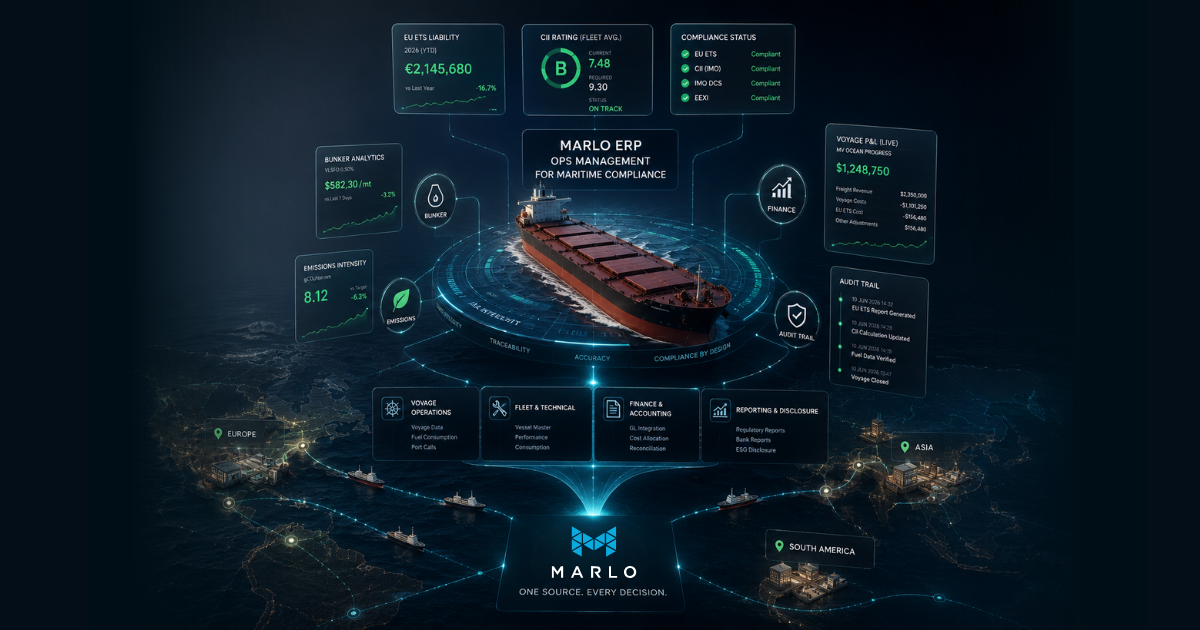
Marlo ERP Ops Management for Maritime Compliance
Maritime compliance obligations have expanded significantly over the past three years. EU ETS reporting, CII ratings, IMO Carbon Intensity...
Your commercial manager walks into your office with good news.
"Great quarter! We completed 47 voyages with an average estimated profit of $185K per voyage. Fleet TCE is tracking at $14,500/day."
You congratulate the team. The board presentation looks strong. Lenders will be pleased.
Six weeks later, your finance manager delivers the actual numbers.
"Bad news. Actual voyage results are in. Average profit was $128K per voyage—31% below estimate. Fleet TCE was actually $11,200/day."
What happened?
Bunker consumption ran 8-12% over plan on 60% of voyages (nobody noticed until fuel invoices reconciled). Demurrage claims arrived 20-45 days post-discharge, totalling $680K in unexpected charges. Port disbursements were 15-20% over budget across multiple ports. Three voyages lost money entirely, but looked profitable in estimates.
The worst part? While you were celebrating those estimated results, your commercial team already fixed the next 38 voyages—many on the same routes that actually lost money.
By the time you know which trades were profitable, you've already committed to repeating the unprofitable ones.
This is the maritime CFO's voyage profitability blindness problem. And it's costing your company 15-25% in potential fleet earnings.
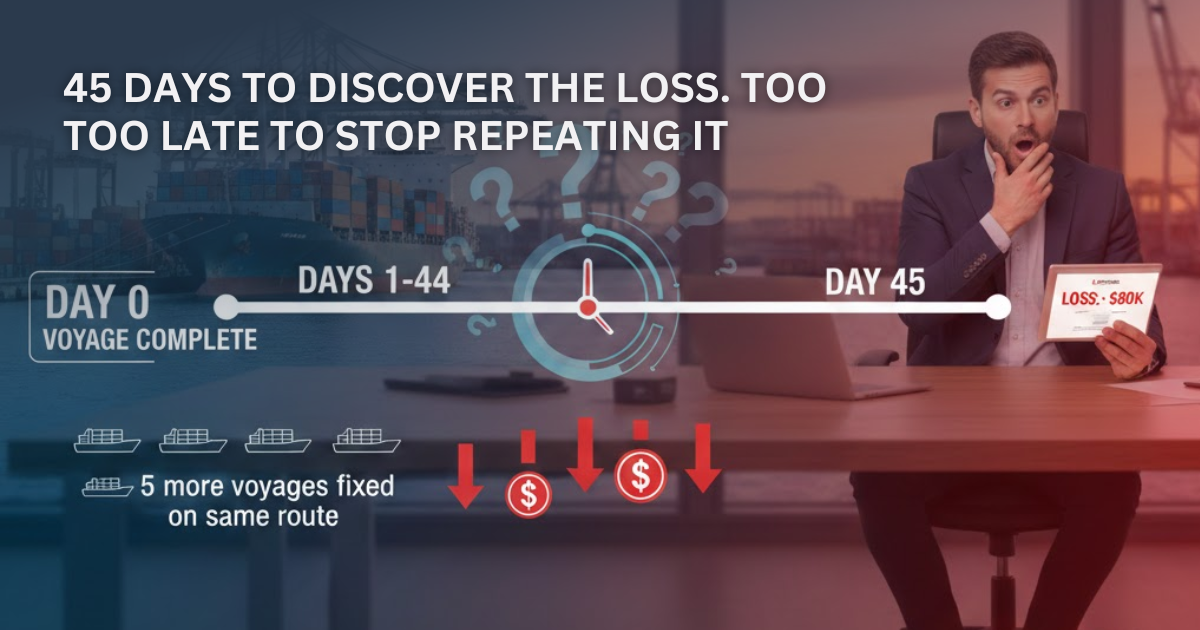
Here's the typical voyage P&L timeline with traditional VMS systems:
Day 0: Voyage completes, vessel discharges cargo
Days 1-15: Waiting for final costs to arrive
Bunker delivery notes reconciled (5-10 days)
Port agent final disbursement accounts (7-14 days)
Demurrage claims from charterers (15-90 days, often contested)
Canal transit fees finalized (3-7 days)
Additional port charges (10-20 days)
Days 16-30: Finance team reconciliation process
Export voyage data from VMS
Match invoices to voyage numbers
Reconcile estimated vs actual costs
Calculate variances
Update voyage P&L
Days 31-45: Final review and reporting
CFO reviews voyage results
Management reporting prepared
Variance analysis completed
Lessons learned documented (rarely)
Day 45+: Finally know whether the voyage made or lost money
Problem: Your commercial team makes 20-40 new fixture decisions in those 45 days, many based on stale assumptions about which routes are profitable.
Maritime voyage estimates are notoriously inaccurate.
Industry average variance: 25-40% between estimated and actual voyage profit
Common variance drivers:
1. Bunker Consumption
Estimated: Based on vessel performance specs and ideal weather
Actual: Weather routing, sea conditions, vessel fouling, engine performance
Typical variance: 5-15% higher consumption than estimate
Example:
Estimated bunker cost: $180K (650 MT @ $277/MT)
Actual bunker cost: $205K (720 MT @ $285/MT)
Variance: +$25K (14% over estimate)
2. Port Costs and Disbursements
Estimated: Standard tariff rates
Actual: Additional services, weekend/holiday surcharges, agent fees, local taxes
Typical variance: 10-20% higher than estimate
Example:
Estimated port costs: $85K
Actual port costs: $98K (additional tug, longer berth time, storage fees)
Variance: +$13K (15% over estimate)
3. Demurrage and Despatch
Estimated: Assume on-time loading/discharge within laytime
Actual: Port congestion, cargo delays, weather, equipment breakdowns
Typical variance: Highly unpredictable, can swing ±$50K-$200K
Example:
Estimated demurrage: $0 (assumed on-time performance)
Actual demurrage: $68K (4 days delay at $17K/day)
Variance: +$68K (massive negative swing)
4. Freight Rate Changes
Estimated: Market rate at time of quote
Actual: Rate negotiated days/weeks later, market may have moved
Typical variance: ±5-10% depending on market volatility
Combined Impact:
Voyage Estimate at Fixture:
Freight revenue: $450K
Bunker costs: -$180K
Port costs: -$85K
Canal/other: -$35K
Estimated profit: $150K
Estimated TCE: $13,500/day
Actual Voyage Results (known 45 days post-discharge):
Freight revenue: $450K (unchanged)
Bunker costs: -$205K (over by $25K)
Port costs: -$98K (over by $13K)
Canal/other: -$38K (over by $3K)
Demurrage: -$68K (not in estimate)
Actual profit: $41K
Actual TCE: $6,200/day
Result: 73% profit miss. Voyage that looked excellent actually barely broke even.
By the time you know this, your commercial team has already fixed 3-4 more voyages on the same route using the $150K profit assumption.
Month 1: Commercial team fixes 12 voyages based on estimated profitability
Month 2:
The previous month's actual results are still being compiled
Commercial team fixes 12 more voyages based on estimates
Using outdated assumptions about which routes/cargo types are profitable
Month 3:
Month 1 actual results are finally complete (45-60 days after completion)
Discovery: 4 of those 12 voyages were unprofitable
But the commercial team has already fixed 6 more voyages on those same routes
The cycle

Annual impact for 20-vessel fleet:
240 voyages/year total
30% have material estimate variance (72 voyages)
15% are actually unprofitable but looked good in estimate (36 voyages)
Average loss on unprofitable voyages: $45K
Total hidden losses: $1.62M annually
Plus opportunity cost: The vessels deployed on losing voyages could have been fixed on profitable routes if you'd known in real-time which trades were working.
Typical maritime company organizational problem:
Commercial team:
Lives in VMS (Veson IMOS, Dataloy, etc.)
Focuses on freight rates, cargo matching, vessel positioning
Tracks estimated voyage P&L
Makes fixture decisions based on estimates
Measured on: Utilization %, freight rate achievements, estimate targets
Finance team:
Lives in accounting system (NetSuite, QuickBooks, SAP)
Focuses on actual costs, invoice matching, accruals
Tracks actual voyage P&L
Reconciles estimates to actuals
Measured on: Accurate financial reporting, month-end close speed
The gap: Two teams, two systems, two versions of truth, 45-day delay to reconcile them.
Result:
Commercial makes decisions on estimated data
Finance reports actuals weeks later
Nobody connects the dots to prevent repeating unprofitable patterns
Real scenario:
Commercial Manager (Week 1): "I fixed a great Brazil voyage at $28K/day TCE estimate. We should do more Brazil runs."
CFO (Week 8, after actual results arrive): "That Brazil voyage actually lost $35K due to port delays and higher bunker consumption. TCE was only $8,500/day."
Commercial Manager: "Oh. But I already fixed two more Brazil voyages based on that estimate."
CFO: screams internally
This conversation happens in every maritime company. Monthly.
Small operator (5 vessels):
5-8 voyages/month = 60-96 voyages/year
CFO can manually track voyage results
Finance team reconciles estimates vs. actuals in Excel
Commercial team has informal feedback loops
Mid-size operator (20 vessels):
20-30 voyages/month = 240-360 voyages/year
Manual tracking breaks down
Finance team overwhelmed with reconciliation
Commercial-finance disconnect widens
15-25% of voyages have undetected profitability issues
Large operator (50+ vessels):
50-80 voyages/month = 600-960 voyages/year
Impossible to manually analyze each voyage
Finance team does sampling, not comprehensive review
Commercial decisions increasingly divorced from actual performance
Profitability leakage becomes structural
The scaling problem: As fleet grows, the gap between estimated and actual profitability widens because there's no systematic way to close the feedback loop.
Shipping is one of the most volatile industries.
Bunker price volatility:
VLSFO can swing 20-30% in a quarter
Voyage fixed 45 days before execution
Bunker purchased at different price than estimate
Every $50/MT bunker price change = $30K-$50K voyage P&L impact
Port congestion volatility:
Estimate assumes 2-day port time
Actual port time: 6 days due to congestion
4 days demurrage at $18K/day = $72K variance
One port delay wipes out entire voyage profit
Freight rate volatility:
Baltic Dry Index can move 10-15% between estimate and fixture
Spot market voyages especially vulnerable
Estimate based on Friday's market, fixture on Tuesday at different rate
Weather and routing volatility:
Hurricane season forces alternate routing
Canal closures or restrictions
Speed reductions due to heavy weather
Each adds days and bunker consumption not in estimate
Combined volatility effect:
Stable market environment:
Estimate accuracy: 85-90%
Most voyages perform close to estimate
Volatile market environment:
Estimate accuracy: 60-70%
Wide variance between estimate and actual
By the time you know actuals, market has moved again
CFO nightmare: Making decisions on 60% accurate data that's 45 days old in a market that moves 10% monthly.
Demurrage is the silent profit killer.
How demurrage works:
Charter party specifies laytime for loading/discharge
Delays beyond laytime trigger demurrage charges
Demurrage rates: $10K-$30K/day depending on vessel size
The timing problem:
During voyage: You know delays are happening, but formal demurrage claim hasn't been calculated or submitted
Post-discharge:
Day 1-15: Charterer calculates laytime, prepares claim
Day 15-30: Claim submitted to shipowner
Day 30-60: Negotiation, dispute resolution
Day 60-90+: Settlement or arbitration
Financial reporting impact:
Month voyage completes:
No demurrage invoice yet
Voyage P&L shows estimated profit
CFO reports profit that includes unrecognized liability
Month +2 (demurrage claim arrives):
$85K demurrage invoice hits
Prior voyage profit evaporates
CFO must restate that voyage's results
Problem: By the time demurrage claim is finalized, you've already:
Reported the voyage as profitable
Used that profit assumption for new commercial decisions
Potentially fixed more voyages with same charterer/port
Real example:
Q3 voyages show $2.1M estimated profit
Q4: Demurrage claims from Q3 voyages arrive totaling $680K
Q3 profit restated to $1.42M (32% reduction)
Lenders question why you reported $2.1M then revised to $1.42M
CFO credibility damaged
The most expensive cost isn't the losing voyages—it's the profitable voyages you didn't do because your vessel was tied up on an unprofitable voyage.
Scenario:
Your 75K DWT Panamax vessel completes voyage:
Route: US Gulf to China
Estimated profit: $165K
Actual profit (discovered 45 days later): $48K
While waiting 45 days for actual results, you fixed the vessel on:
Another US Gulf to China voyage (looked profitable in estimate)
Using the $165K estimate to justify the route
What you didn't know:
A Brazil to China voyage was available paying $210K actual profit
You passed on it because your vessel was committed to the second US Gulf voyage
That second US Gulf voyage also performed poorly (actual: $52K)
Total opportunity cost:
Two US Gulf voyages: $100K actual profit
Could have done: One Brazil voyage + one other: $350K+ profit
Opportunity cost: $250K in one quarter
This happens systematically when you don't have real-time voyage profitability data.
Your commercial team is optimizing on stale estimates, not actual performance.
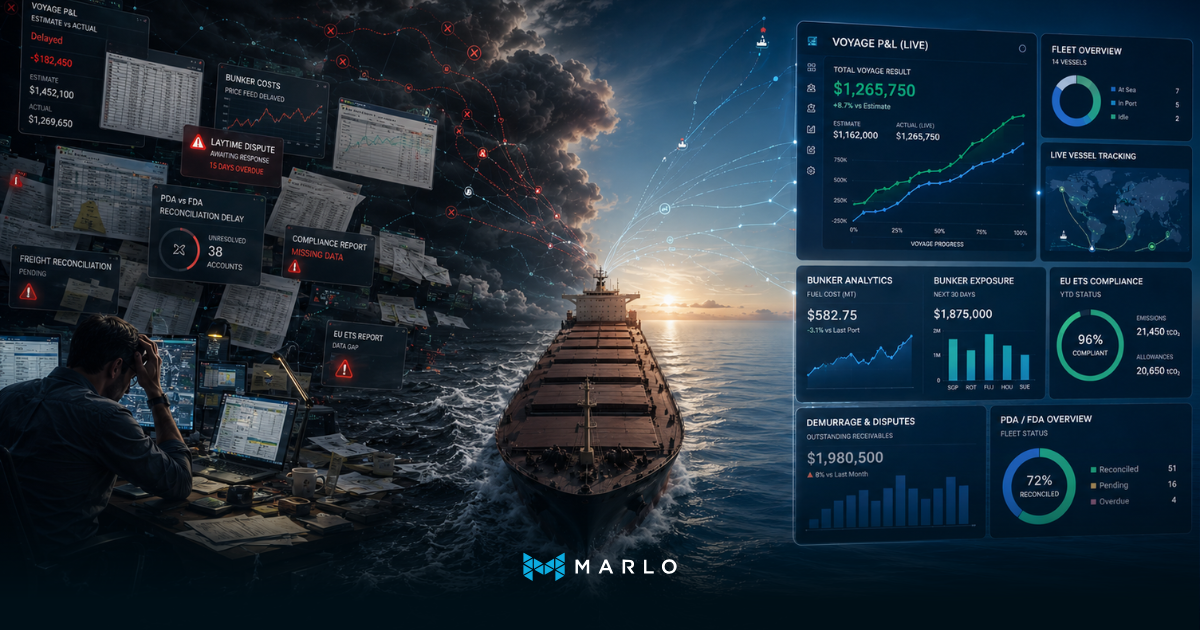
Traditional approach:

Real-time approach:

The fundamental shift: From batch reconciliation after-the-fact to continuous P&L updates during voyage execution.
How real-time voyage P&L works:
Pre-voyage (fixture stage):
Estimated P&L calculated in VMS
Budget set for bunkers, port costs, voyage duration
During voyage:
Noon reports arrive daily from the vessel
Actual bunker consumption vs. estimate
Speed/weather conditions
ETA updates
System auto-calculates:
Bunker variance (running 8% over? Flag it)
Schedule variance (running 2 days behind? Calculate demurrage exposure)
Updated voyage P&L based on actual performance so far
At loading port:
Port agent posts disbursement account
System auto-imports:
Loading time vs. laytime allowance
Updated demurrage/despatch position
Actual port costs vs. estimate
At discharge port:
Same process for discharge costs
Laytime calculation finalized
Demurrage accrued in real-time (even if invoice not received)
Result: By the time vessel completes discharge, you know:
Actual bunker costs (not estimated)
Actual port costs (not estimated)
Actual or highly accurate demurrage position
Actual voyage profit within 2-3% of final
Timeline comparison:
| Event | Traditional System | Real-Time System |
| Voyage completes | Estimated P&L only | 95% accurate P&L |
| +7 days | Waiting for invoices | Actual P&L (within 2%) |
| +30 days | Still reconciling | Final P&L confirmed |
| +45 days | Finally know actual | Long done, already optimizing next voyages |
The game-changer: Know voyage profitability in 7 days, not 45 days.
The power of real-time monitoring isn't just knowing final results faster—it's catching problems while you can still do something about them.
Bunker Consumption Monitoring:
Day 3 of voyage:
Noon report shows consumption: 42 MT/day
Budget was: 38 MT/day
Variance: +10.5% overconsumption
Automated alert to operations:"Vessel consuming 10.5% over budget. At current rate, bunker costs will exceed estimate by $28K. Investigate: weather routing, engine performance, or fouling."
Operations actions:
Contact vessel, request explanation
Discover: Engine running inefficiently after recent repairs
Adjust remaining voyage plan
Reduce final variance from projected $28K to $12K
Without real-time monitoring: Discover overconsumption 45 days later when bunker invoice reconciled. No opportunity to correct. Full $28K variance hits profit.
Port Delay Monitoring:
At loading port, Day 2:
Charter party laytime: 3 days
Current loading rate: 12K MT/day
Cargo to load: 72K MT
Projected loading time: 6 days
Demurrage exposure: 3 days at $16K/day = $48K
Automated alert to commercial:"Loading running 3 days behind schedule. Projected demurrage exposure $48K. Consider: expediting cargo delivery, negotiating despatch terms, or requesting laytime extension."
Commercial actions:
Contact charterer about slow loading
Negotiate reduced demurrage rate for delays beyond shipowner control
Reduce demurrage from $48K to $18K through proactive negotiation
Without real-time monitoring: Discover demurrage 30 days after discharge when claim arrives. No opportunity to negotiate. Full $48K charge.
The pattern: Real-time alerts create intervention opportunities that don't exist with delayed reporting.
The root cause of the 45-day reporting lag: VMS and accounting systems are disconnected.
Legacy architecture:

Two systems, two databases, manual reconciliation required
Integrated architecture:

What integration actually means:
When charter party is entered:
VMS module creates voyage
Finance module creates revenue budget
System sets up GL accounts automatically
No duplicate data entry
When noon report arrives:
VMS captures consumption data
Finance module updates bunker cost accruals
P&L recalculates automatically
No manual export/import
When port invoice arrives:
Email auto-forwarded to system
AI matches invoice to voyage
Costs posted to correct voyage automatically
P&L updates in real-time
When freight invoice is sent:
VMS generates invoice from charter terms
Finance posts receivable automatically
Banking tracks payment receipt
Cash collection monitored without manual work
Result:
Voyage data entered once, used everywhere
No reconciliation gaps between operations and finance
P&L always current (not 45 days stale)
Time savings:
Manual voyage-to-finance reconciliation: 40-60 hours/month
Automated reconciliation: 2-3 hours/month (review only)
95%+ time savings
TCE (Time Charter Equivalent) is the maritime industry's key profitability metric.
TCE formula: TCE = (Freight Revenue - Voyage Costs) ÷ Voyage Days
Traditional TCE problem: You calculate estimated TCE at fixture, actual TCE 45 days after voyage completion.
Real-time TCE advantage: Calculate actual TCE continuously during voyage execution.
Real-world application:
Fleet of 15 Panamax vessels, multiple trade routes:
Traditional monthly reporting:
| Route | Voyages | Estimated TCE | Actual TCE | Variance |
| US Gulf → China | 8 | $12,500/day | $9,200/day | -26% |
| Brazil → China | 4 | $11,800/day | $13,100/day | +11% |
| Australia → India | 6 | $10,200/day | $10,800/day | +6% |
Insight (discovered 45 days late):
US Gulf routes underperforming badly
Brazil routes outperforming
But you've already fixed 5 more US Gulf voyages in the past month
Real-time TCE dashboard:
CFO sees today:
US Gulf routes trending -20% below estimate (3 weeks into current voyages)
Brazil routes trending +8% above estimate
Australia routes performing as expected
Immediate commercial actions:
Stop fixing US Gulf routes
Investigate why (port delays? Bunker overconsumption? Demurrage pattern?)
Shift vessels to Brazil routes
Adjust strategy in real-time, not 45 days late
Financial impact:
Scenario 1 (Traditional 45-day lag):
Fix 8 more US Gulf voyages before discovering they're unprofitable
Average loss per voyage: $45K
Total cost of delayed insight: $360K
Scenario 2 (Real-time TCE):
Discover underperformance after 2 voyages
Fix 2 more before shifting strategy
Total cost: $90K
Savings: $270K by catching problem 6 voyages earlier
This is why real-time voyage P&L matters—not just knowing results faster, but making better decisions because you know results faster.
Most powerful capability: Using historical actual performance to improve future estimates.
Machine learning application:
System learns from past voyages:
This vessel on this route in Q3 historically consumes 8% more bunker than estimate
This port historically adds 12 hours to laytime 40% of the time
This charterer historically causes demurrage on 25% of voyages
When estimating new voyage:
Base estimate: $175K profit
AI-adjusted estimate: $142K profit
+8% bunker consumption adjustment: -$15K
+12 hour port time adjustment: -$8K
25% probability of demurrage: -$10K expected value
Result: Estimates become more accurate over time as system learns actual performance patterns.
Commercial benefit: Make fixture decisions on 90%+ accurate estimates instead of 65% accurate estimates.
CFO benefit: Reduced variance between budget and actual, more predictable financial performance.
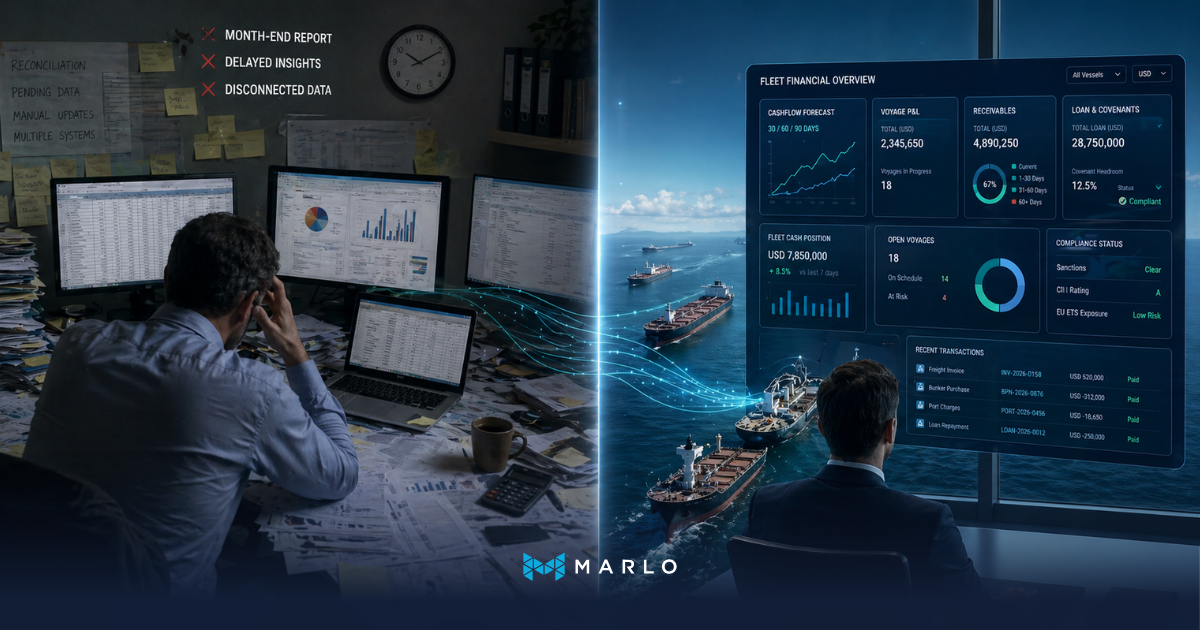
Before real-time voyage P&L:
Month 1 (September):
12 voyages complete
All showing estimated profit
CFO reports $1.8M voyage profit in September
Commercial team makes October fixture decisions based on September estimates
Month 2 (October):
September actual costs still trickling in
Preliminary actuals show September profit closer to $1.3M
CFO nervous but waiting for final reconciliation
Commercial team continues fixing voyages based on outdated September estimates
Month 3 (November):
September actuals finalized: $1.15M (36% below estimate)
Discovering September losses in November
Commercial team has already fixed 24 more voyages using September's bad assumptions
CFO explains variance to board, lenders
After real-time voyage P&L:
Day 7 after voyage completion:
95% accurate P&L available
September voyages known to be underperforming by Week 2 of October
Commercial team adjusts strategy immediately
CFO reports accurate numbers to board monthly
Day 30:
Final 100% reconciliation complete
Minor adjustments only (2-3% variance)
No surprises, no major restatements
The transformation:
Decision lag: 45 days → 7 days (85% reduction)
Estimate accuracy: 65% → 93% (through learning and adjustment)
Repeated mistakes: 6-8 voyages → 1-2 voyages before catching pattern
Real scenario: Route optimization
Your commercial manager is evaluating two fixture options for a Panamax vessel:
Option A: US Gulf → China
Freight: $1.85M
Estimated costs: $1.62M
Estimated profit: $230K
Estimated TCE: $11,500/day
Option B: Brazil → China
Freight: $1.72M
Estimated costs: $1.51M
Estimated profit: $210K
Estimated TCE: $11,200/day
Traditional decision (based on estimates):
Real-time data-informed decision:
CFO pulls up actual performance dashboard:
US Gulf → China route (past 6 months):
Average actual profit: $168K (27% below estimates)
Average actual TCE: $8,900/day
Variance drivers: Port delays (35% of voyages), higher bunker consumption
Brazil → China route (past 6 months):
Average actual profit: $227K (+8% above estimates)
Average actual TCE: $12,100/day
Consistent performance, minimal variance
Data-informed decision:
Choose Option B (lower estimate but higher actual expected performance)
Expected actual profit: $227K vs. $168K
Better decision worth $59K in actual profit
Annual impact: 30-40 better fixture decisions = $1.5M-$2.5M additional actual profit
This is impossible without real-time actual performance data feeding back into commercial decisions.
The traditional conflict:
Commercial team complaint:"Finance takes 6 weeks to tell us whether voyages were profitable. By then it's useless information. We need to make decisions today."
CFO response:"We report as fast as we can. Invoices arrive late, reconciliation is complex. Commercial keeps using optimistic estimates that don't reflect reality."
Result: Two teams, different incentives, finger-pointing when results miss expectations.
Real-time P&L creates alignment:
Shared real-time dashboard:
Commercial sees actual performance emerging during voyage
Finance sees operational factors driving variance
Both teams working from same data, same timeline
Weekly voyage review meeting:
Review voyages completed past week
Actual P&L available (not estimated)
Discuss variance drivers
Adjust future estimates/strategy together
Collaborative problem-solving vs. blame game
Aligned incentives:
Commercial compensated on actual TCE, not estimated TCE
Estimates become more accurate because there's faster feedback
Finance spends less time reconciling, more time supporting decisions
Cultural transformation:
From "operations vs. finance" to "one team optimizing fleet profitability"
From "who's responsible for the variance" to "how do we prevent it next time"
From reactive ("what went wrong") to proactive ("what will we do better")
Board meetings before real-time P&L:
CFO presents September results in November board meeting:"September voyage profit was $1.8M based on estimates. We're still finalizing actuals. October update: September actual profit revised to $1.3M. We're investigating the $500K variance."
Board reaction: "Why don't you know your numbers? What's the current quarter looking like? Should we be concerned?"
CFO credibility: Damaged.
Board meetings after real-time P&L:
CFO presents September results in October board meeting:"September voyage profit: $1.32M, 98% finalized. This is 8% below our monthly budget of $1.44M. The variance was driven by port delays in Brazil (3 voyages, $85K impact) and higher bunker costs (+6% above estimate, $72K impact). We've already adjusted October fixtures to avoid Brazil until port congestion clears."
Board reaction: "Good visibility. What's the outlook for Q4?"
CFO credibility: Enhanced.
Lender reporting:
Quarterly covenant compliance certification requires:
EBITDA calculation including voyage profits
Accurate working capital (receivables, payables)
Cash flow forecast
With 45-day voyage P&L lag:
Q3 ends September 30
September voyage actuals not final until mid-November
Covenant certificate delayed
EBITDA includes significant estimated components
Lender questions accuracy of reported metrics
With real-time voyage P&L:
Q3 ends September 30
All September voyages 95%+ finalized by October 7
Covenant certificate ready by October 10
EBITDA based on actuals, not estimates
Lender receives timely, accurate reporting
Lender relationship impact:
Timely reporting → Lender confidence in management
Accurate reporting → Better pricing on refinancing
Proactive communication → Preferred borrower status
You cannot achieve real-time voyage P&L with disconnected systems.
Why standalone VMS fails:
VMS tracks operational data (voyage, costs, cargo)
Accounting tracks financial data (invoices, payments, GL)
Gap between systems = 30-45 day reconciliation delay
Why standalone accounting fails:
Accounting sees invoices, not voyage context
Can't calculate voyage P&L without VMS data
Finance team becomes manual integrator = slow, error-prone
What integrated maritime ERP delivers:
Voyage data and financial data in same database
Operational events trigger financial updates automatically
No reconciliation gap
Real-time possible because data lives in one place
CFO evaluation criteria:
Single database architecture (not separate modules that sync)
Operational-to-financial automation (voyage events create accounting entries)
Real-time calculation engine (P&L updates as data changes)
Audit trail (can trace every P&L component to source transaction)
Real-time P&L is only as good as real-time data inputs.
Critical data feeds:
1. Vessel noon reports
Daily position, speed, consumption reports from vessels
Must be: Automated (email-to-system integration), daily, structured format
Quality issue: Late noon reports, inconsistent data = delayed P&L updates
2. Port agent disbursement accounts
Port costs, services, disbursements as they occur
Must be: Electronic format (PDF at minimum, structured data ideal), timely submission
Quality issue: Agents submit 15+ days after port call = delayed actual costs
3. Invoice automation
Bunker invoices, canal fees, services
Must be: AI invoice processing (email-to-GL automation)
Quality issue: Manual invoice entry creates delays
4. Charter party terms
Freight rates, laytime, demurrage rates
Must be: Entered completely and accurately in VMS
Quality issue: Missing terms = wrong accrual calculations
Implementation requirement:
Clean up data processes before expecting real-time benefits
Automate vessel reporting (most modern vessels already have this)
Negotiate electronic reporting with agents
Implement AI invoice processing
Timeline:
Data cleanup: 2-4 weeks
Process automation setup: 3-4 weeks
Total: 6-8 weeks to achieve real-time capability
Commercial teams may resist real-time P&L initially.
Why?
Concern 1: "Real-time actuals will make our estimates look bad."
Reality: Estimates always look bad when compared to delayed actuals. Real-time just reveals it faster.
Benefit: Faster feedback improves estimate accuracy. Within 6 months, estimates get significantly better.
Concern 2: "Finance will second-guess every fixture decision."
Reality: With real-time visibility, finance becomes partner not critic.
Benefit: CFO can support commercial decisions with data, not question them after the fact.
Concern 3: "This will slow down our fixture process."
Reality: Real-time P&L doesn't change fixture process—it improves post-fixture learning.
Benefit: Make faster, better decisions because you know which routes actually work.
CFO leadership approach:
1. Position as commercial advantage, not finance control
"This helps commercial make better decisions faster"
NOT: "This helps finance catch commercial mistakes"
2. Involve commercial in defining what to track
Which variance alerts are useful vs. noise?
What benchmarks help commercial optimize routes?
3. Celebrate commercial wins enabled by real-time data
"Commercial caught port delay risk early, avoided $50K demurrage"
"Commercial shifted strategy based on actual TCE data, improved profit 12%"
4. Compensate commercial on actuals, not estimates
Align incentives with accurate performance measurement
Creates natural buy-in for real-time visibility
Evaluation criteria for real-time voyage P&L capability:
1. True integration (not bolted-on modules)
Ask: "Is voyage data and financial data in same database?"
Red flag: "Our VMS syncs with accounting nightly"
Green flag: "Single database, real-time data flow"
2. Automated data capture
Ask: "How do noon reports, invoices, and agent reports get into the system?"
Red flag: "Users manually enter data from emails"
Green flag: "AI processes emails, auto-populates voyage costs"
3. Real-time calculation engine
Ask: "When does voyage P&L update after new cost is posted?"
Red flag: "P&L recalculates overnight in batch"
Green flag: "P&L updates within seconds of new data"
4. Variance alerting
Ask: "How do I know when a voyage is underperforming?"
Red flag: "You run a report and look for variances"
Green flag: "Automated alerts when variance exceeds thresholds"
5. Historical performance analytics
Ask: "Can I see average actual performance by route/vessel/charterer?"
Red flag: "You'd have to export to Excel and analyze"
Green flag: "Built-in analytics with route/vessel/charterer profitability trending"
Demo request:"Show me a voyage that's currently executing. Show me the live P&L. Now post a new cost and show me the P&L update. Show me variance alerts. Show me historical route performance."
If vendor can't demonstrate real-time capability live, they don't have it.
1. Avoided unprofitable voyage repetition
Current: Repeat 8-12 unprofitable voyages before discovering pattern
With real-time P&L: Catch pattern after 2-3 voyages
Average loss per unprofitable voyage: $45K
Annual savings: $270K-$450K (6-10 fewer losing voyages)
2. Improved commercial decision-making
Better route selection based on actual performance
Estimated fleet TCE improvement: 5-8%
20-vessel fleet @ $11K/day average TCE
Annual value: $400K-$640K (incremental earnings)
3. Reduced finance team reconciliation workload
Current: 50 hours/month voyage-to-GL reconciliation
With integration: 5 hours/month review only
45 hours saved/month × $125/hour loaded cost
Annual savings: $67.5K
4. Faster cash collection
Real-time freight invoicing (vs. delayed)
Estimated DSO improvement: 5-7 days
$2M average monthly revenue
Working capital freed: $330K-$460K
Cost of capital at 6%
Annual value: $20K-$28K
Total annual benefit: $757.5K-$1.185M
5. Board and lender confidence
Accurate, timely reporting
Better covenant compliance
Improved refinancing terms
Value: 10-15bps better pricing = $200K-$300K on $200M debt
6. Risk reduction
Catch operational problems during voyage (bunker overconsumption, port delays)
Avoid compounding losses
Value: Difficult to quantify but significant
7. CFO time reallocation
Less time explaining variances
More time on strategic planning
Value: Opportunity cost of CFO focus
Implementation costs:
System implementation: $60K-$100K (integrated maritime ERP)
Data cleanup and migration: $20K-$30K
Training and change management: $15K-$20K
Year 1 total: $95K-$150K
Ongoing costs:
Annual subscription: $35K-$50K (20-vessel fleet)
Support and maintenance: Included in subscription
5-year TCO:
Implementation (Year 1): $95K-$150K
Subscription (Years 1-5): $175K-$250K
Total 5-year cost: $270K-$400K
5-year value:
Direct benefits (annual): $757.5K-$1.185M
5-year cumulative: $3.79M-$5.93M
Less 5-year cost: -$270K-$400K
Net 5-year value: $3.39M-$5.53M
ROI: 10-15x over 5 years
Payback period: 4-6 months
This doesn't include strategic benefits (better financing terms, risk reduction, CFO credibility).
The maritime industry has accepted 45-day voyage P&L lag as "just how it is" for decades.
This was true when:
Fleets were smaller (manual tracking was feasible)
Markets were less volatile (estimates stayed accurate longer)
Technology didn't exist (integration wasn't possible)
None of those conditions exist today.
Modern maritime reality:
Larger fleets (20-50+ vessels common)
Extreme market volatility (rates swing 20%+ monthly)
Technology exists (integrated cloud ERP is proven)
The CFOs who thrive in the next decade will:
Know voyage profitability in days, not weeks
Make commercial decisions based on actual performance data
Catch operational problems during voyages, not after
Provide accurate, timely reporting to boards and lenders
This requires moving from disconnected VMS + Accounting to integrated maritime ERP with real-time voyage P&L.
The technology exists. The ROI is proven (10-15x over 5 years). The implementation is 8-12 weeks.
For CFOs reading this: You know the frustration of discovering voyage losses 45 days too late. You know the cost of commercial teams repeating unprofitable routes. You know the board questions when you report estimates that don't match actuals.
Real-time voyage P&L solves these problems.
The question isn't whether maritime finance will adopt real-time analytics—it will. Leading operators are already there. The question is whether your company will be an early adopter gaining competitive advantage, or a late adopter watching competitors outperform you.
When do you start?
Marlo (www.marlo.co) provides integrated maritime ERP with real-time voyage P&L capability purpose-built for ship owners and operators in the dry bulk and tanker sectors.
Real-Time Voyage P&L Features:
Live voyage P&L updates as noon reports and costs arrive
Automated variance alerts for bunker consumption, port delays, demurrage exposure
Integrated VMS + Finance for zero-lag operational-to-financial data flow
AI-powered invoice processing for automatic cost capture and matching
Route profitability analytics with historical actual performance by route/vessel/charterer
Predictive voyage estimates using machine learning on historical actuals
Real-time TCE calculations updated continuously during voyage execution
Mobile dashboards for CFO visibility anywhere, anytime
Built for maritime CFOs who need:
✅ 7-day voyage P&L accuracy instead of 45-day delays
✅ Commercial decisions based on actuals instead of stale estimates
✅ Proactive problem-solving instead of post-voyage autopsies
✅ Board confidence instead of variance explanations
Integrated with Marlo's complete maritime platform:
Voyage Management for charter party to discharge workflow
Banking for freight collection and cash flow visibility
Loan Management for covenant compliance
Analytics for fleet performance optimization
Ready to see your fleet's profitability in real-time? Try Marlo for free
Maritime compliance obligations have expanded significantly over the past three years. EU ETS reporting, CII ratings, IMO Carbon Intensity...
Shipping companies invest in operations software to gain control over voyage P&L, bunker costs, laytime exposure, and compliance obligations. Yet...
For most mid-size shipping companies, the CFO's financial picture of the fleet is assembled once a month. Voyage P&L comes from the operations...